
Redmine Custom Dashboard – real-time project health.
For project managers and IT directors who need live project health without building a manual report first.
one-time purchase · 1 year of support included
Support renewal after 1 year 30% of plugin price
Today in Redmine
Project status requires a meeting to produce. Or a report nobody reads.
Redmine’s default views are built around individual issues, not project health. Seeing the state of five projects simultaneously means navigating five project pages – then opening individual issue lists to assess status. IT directors and delivery heads end up compiling manual summaries before every stakeholder review. The information exists inside Redmine; it just takes an hour of navigation to surface it.
In plain words
What is the Redmineflux Custom Dashboard Plugin?
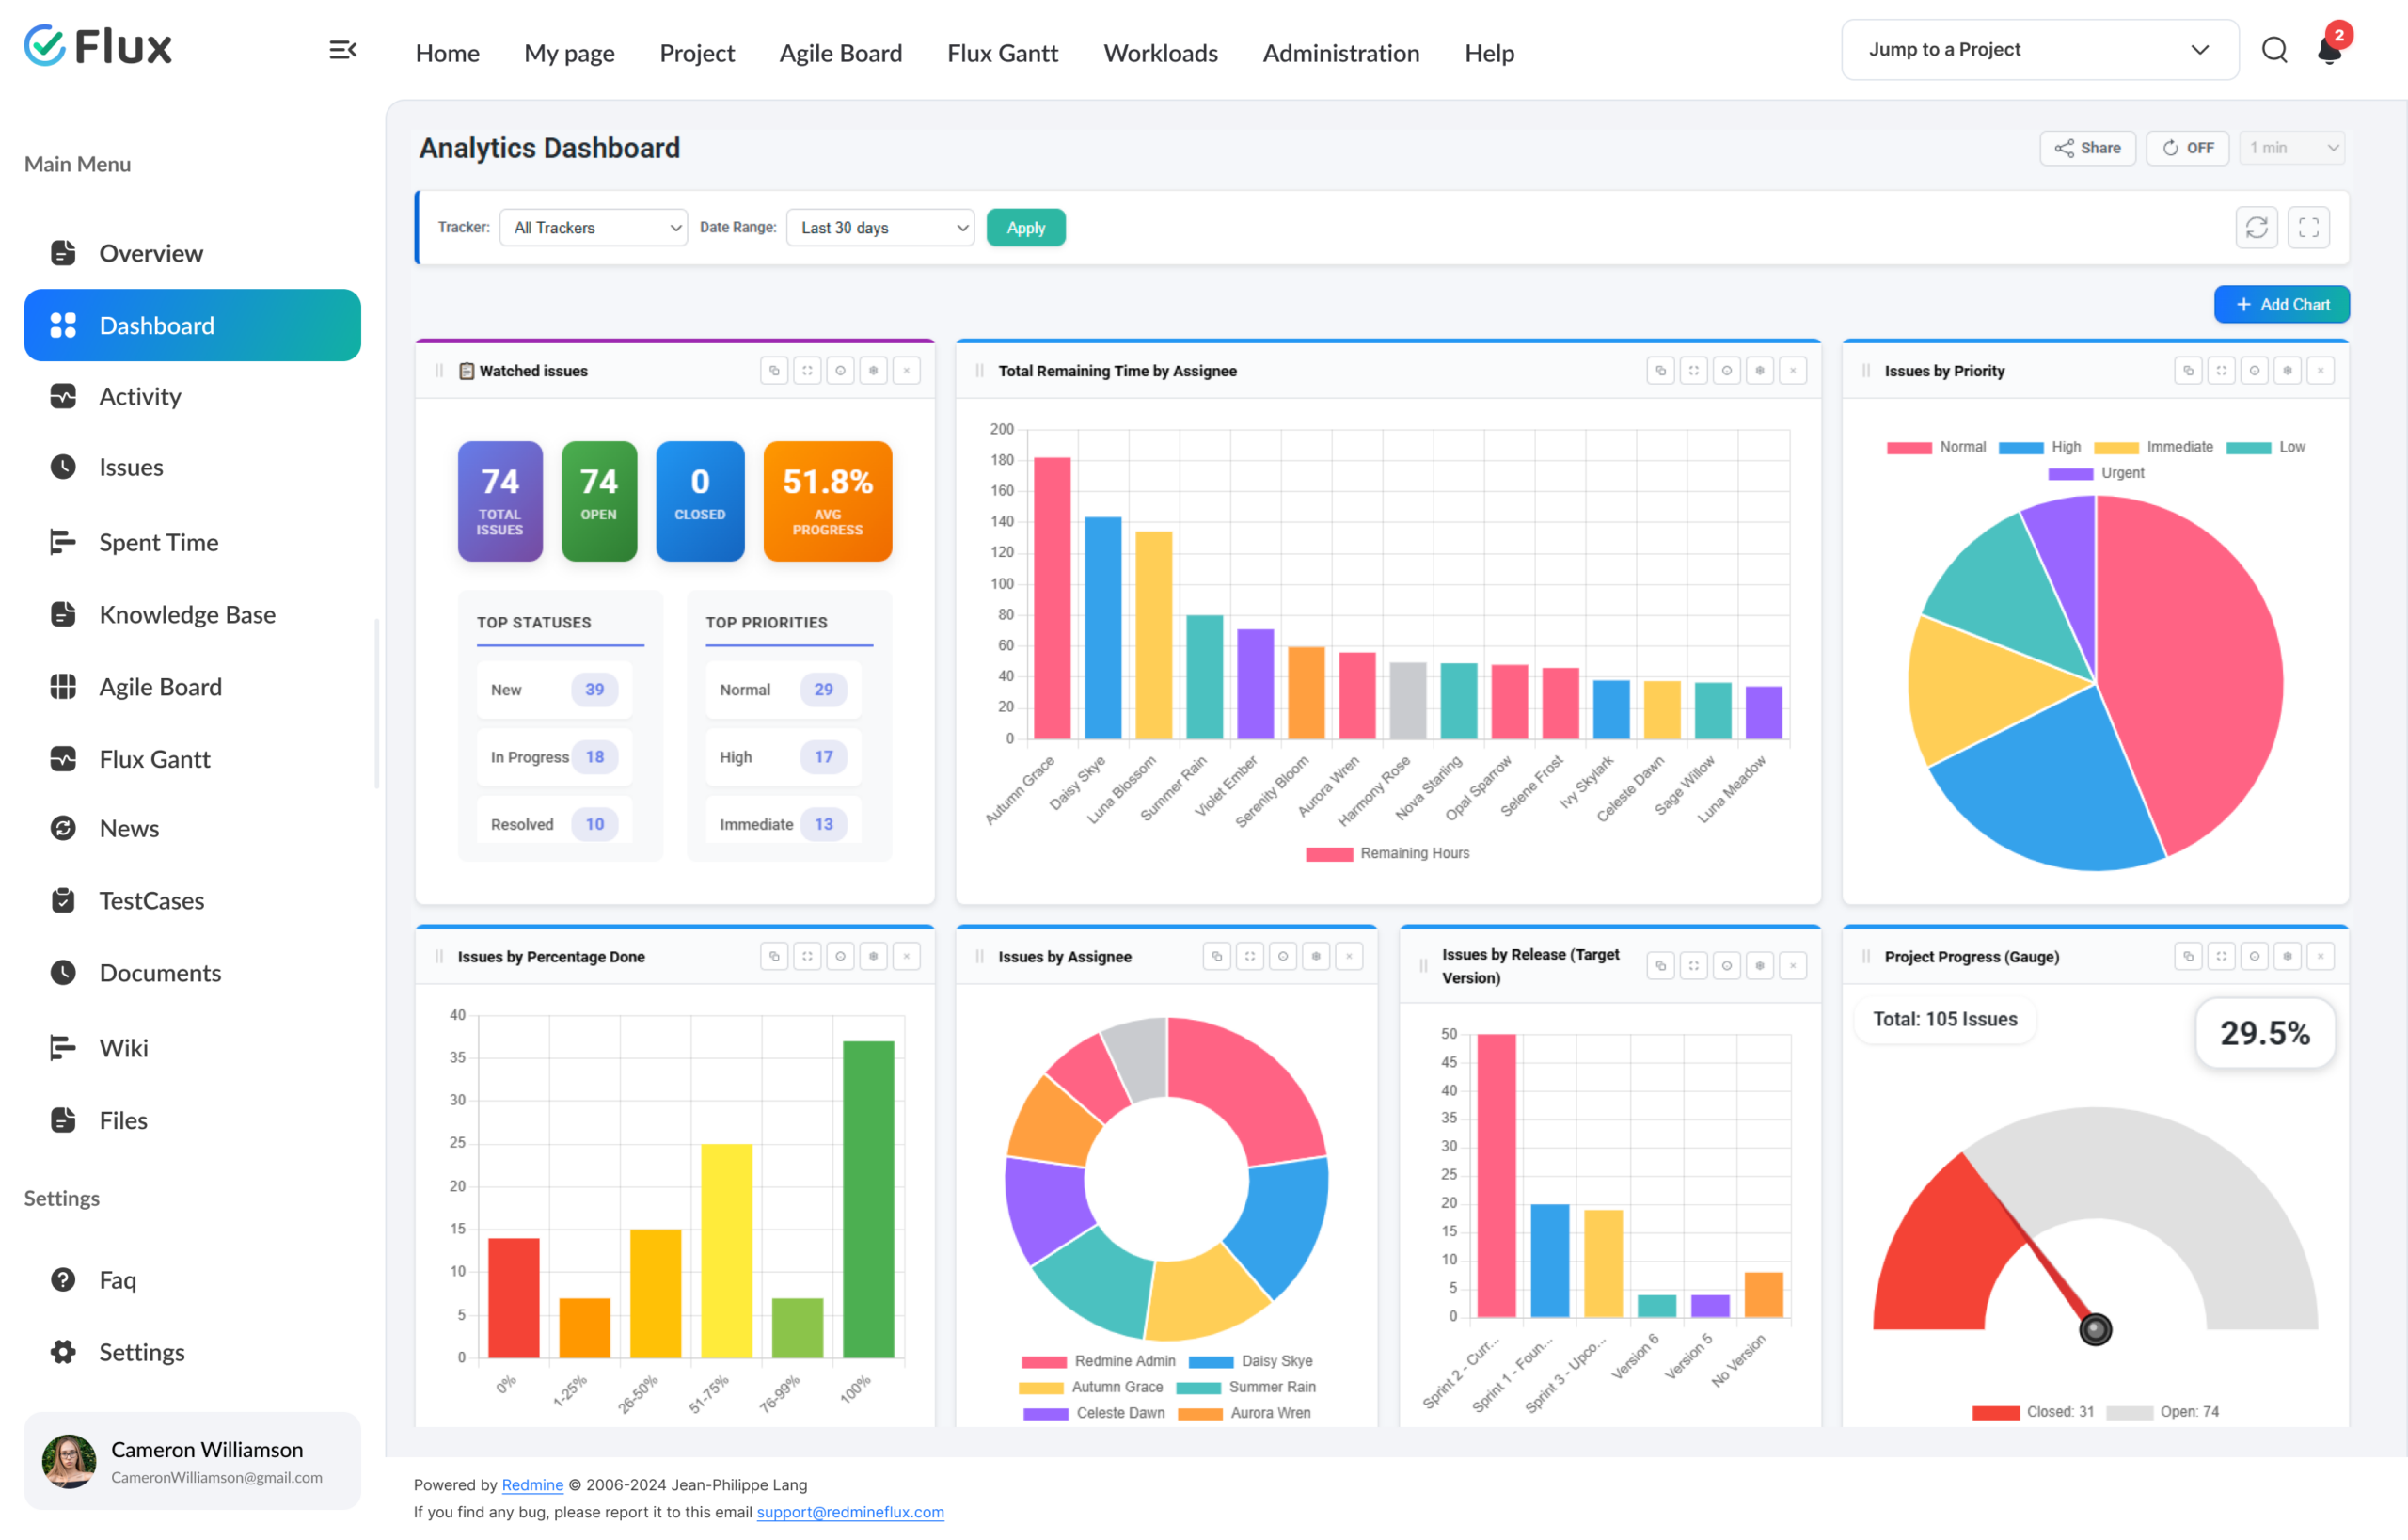
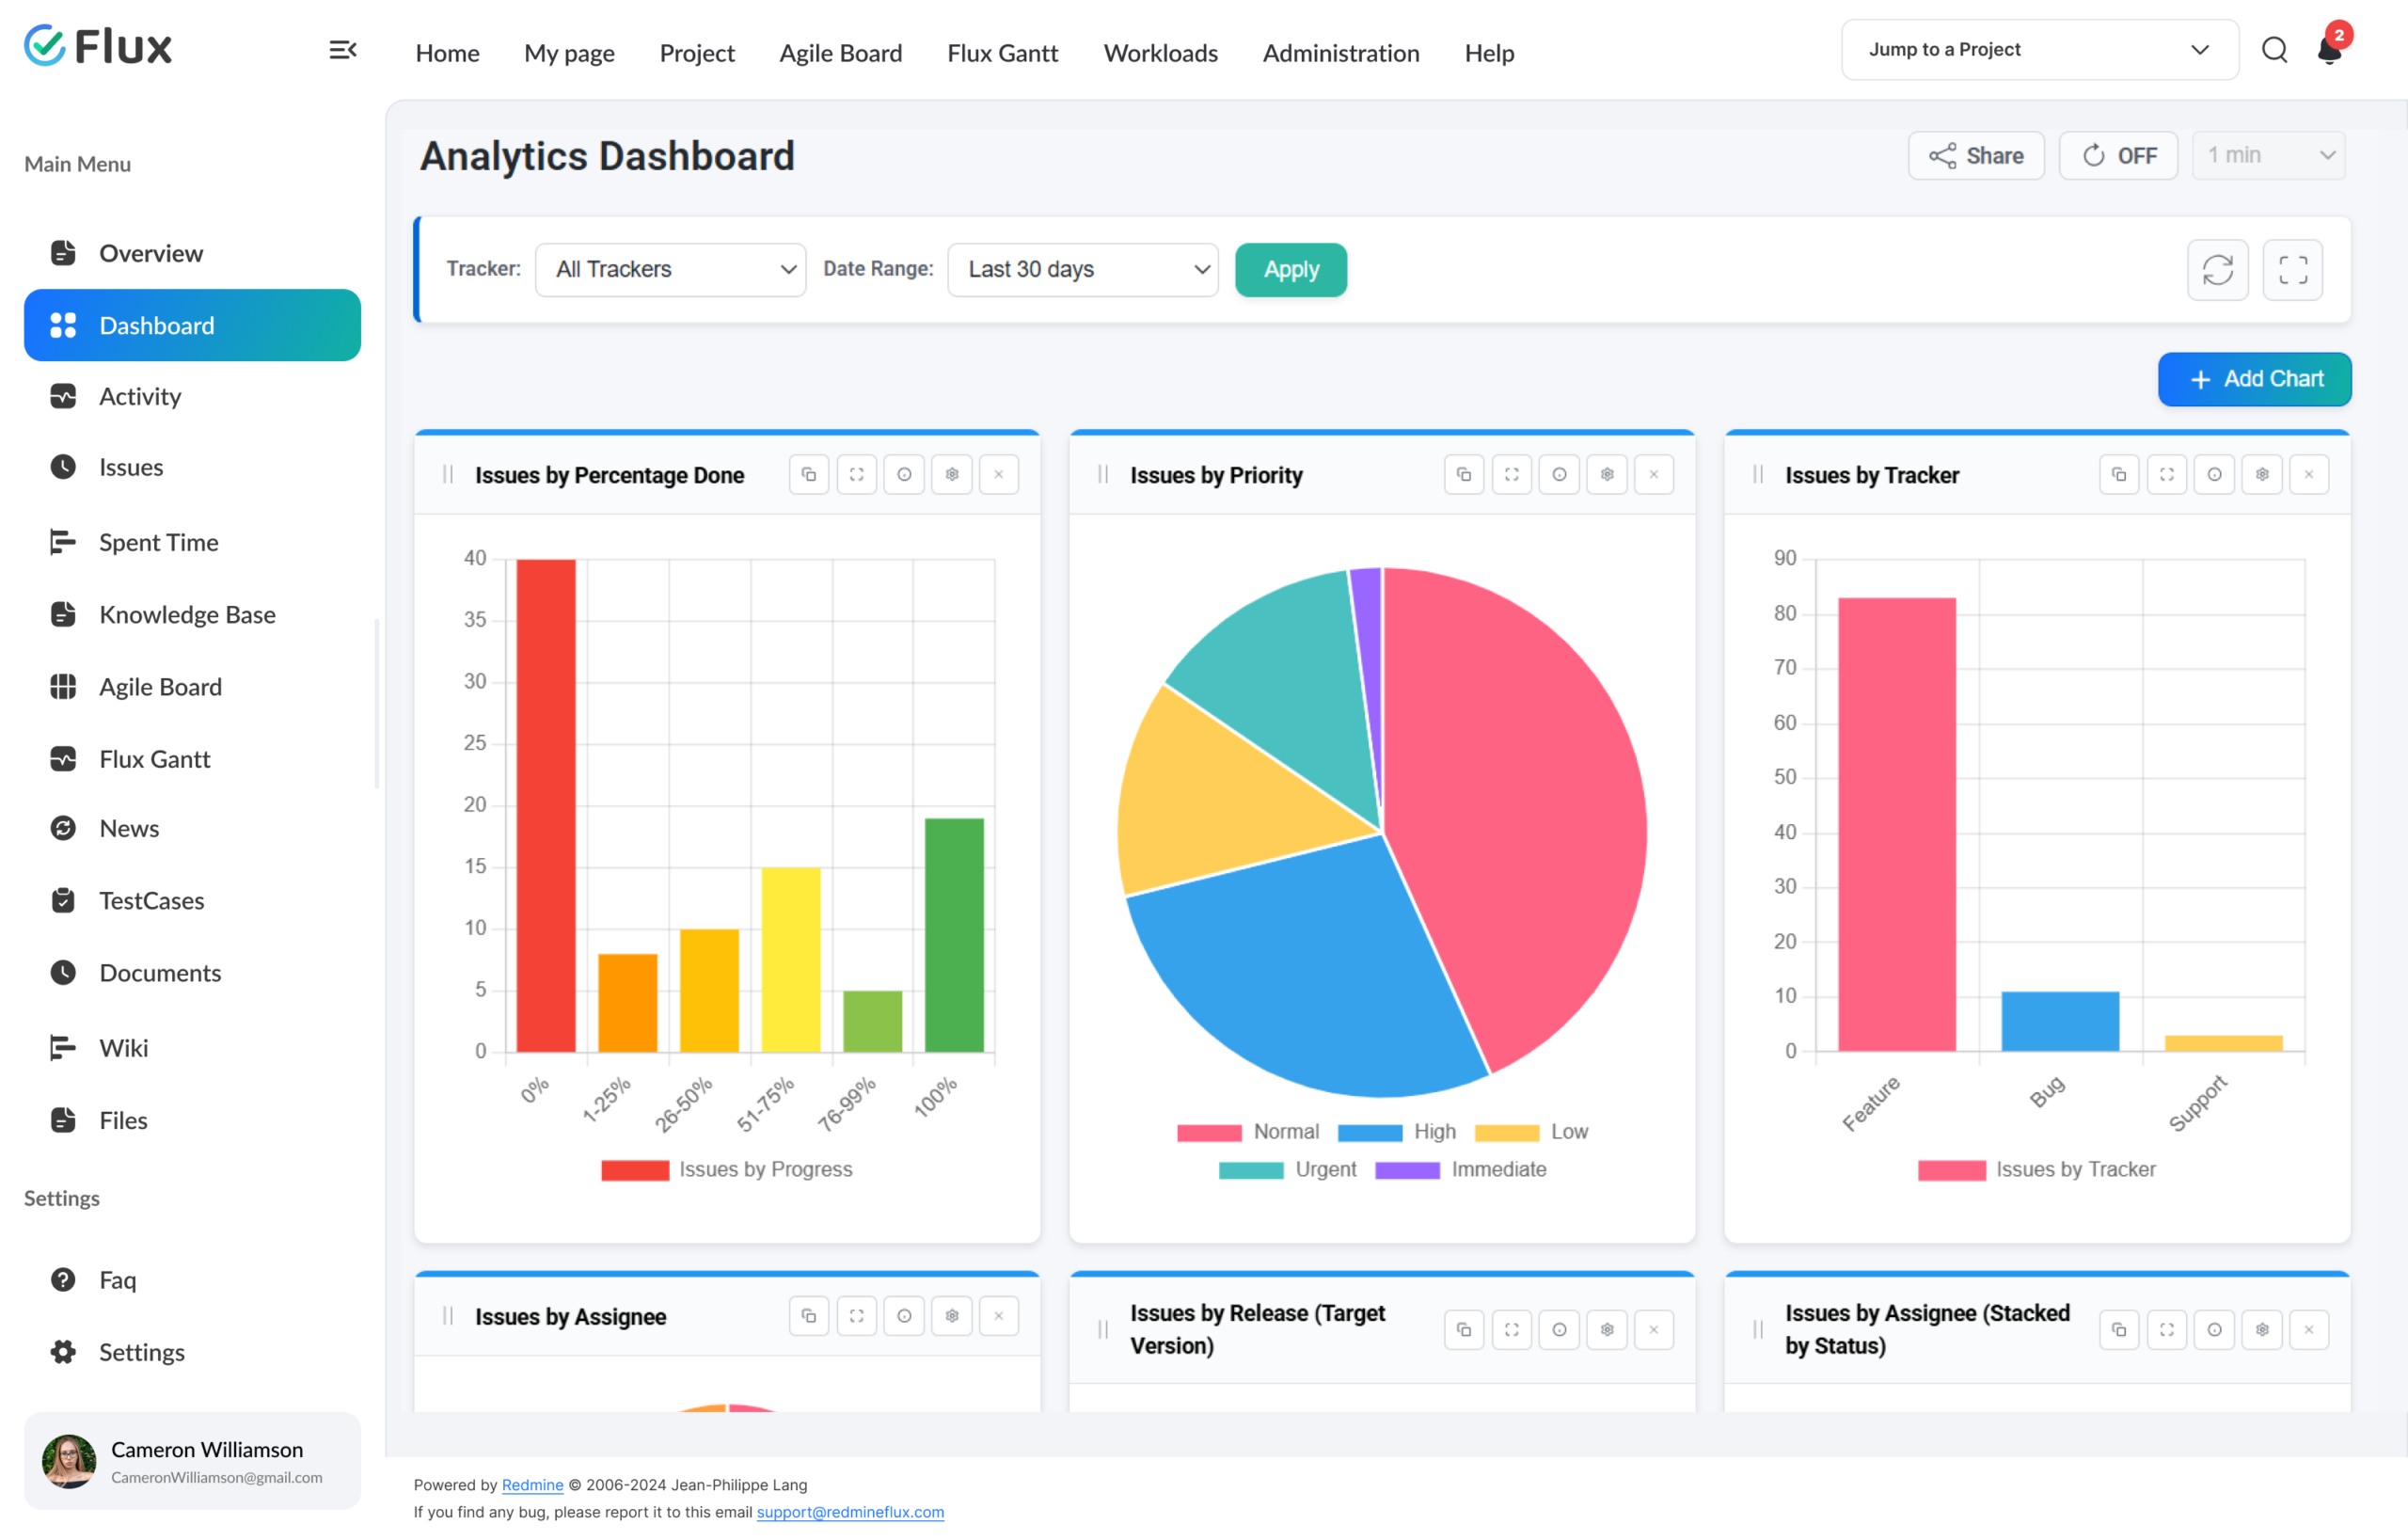
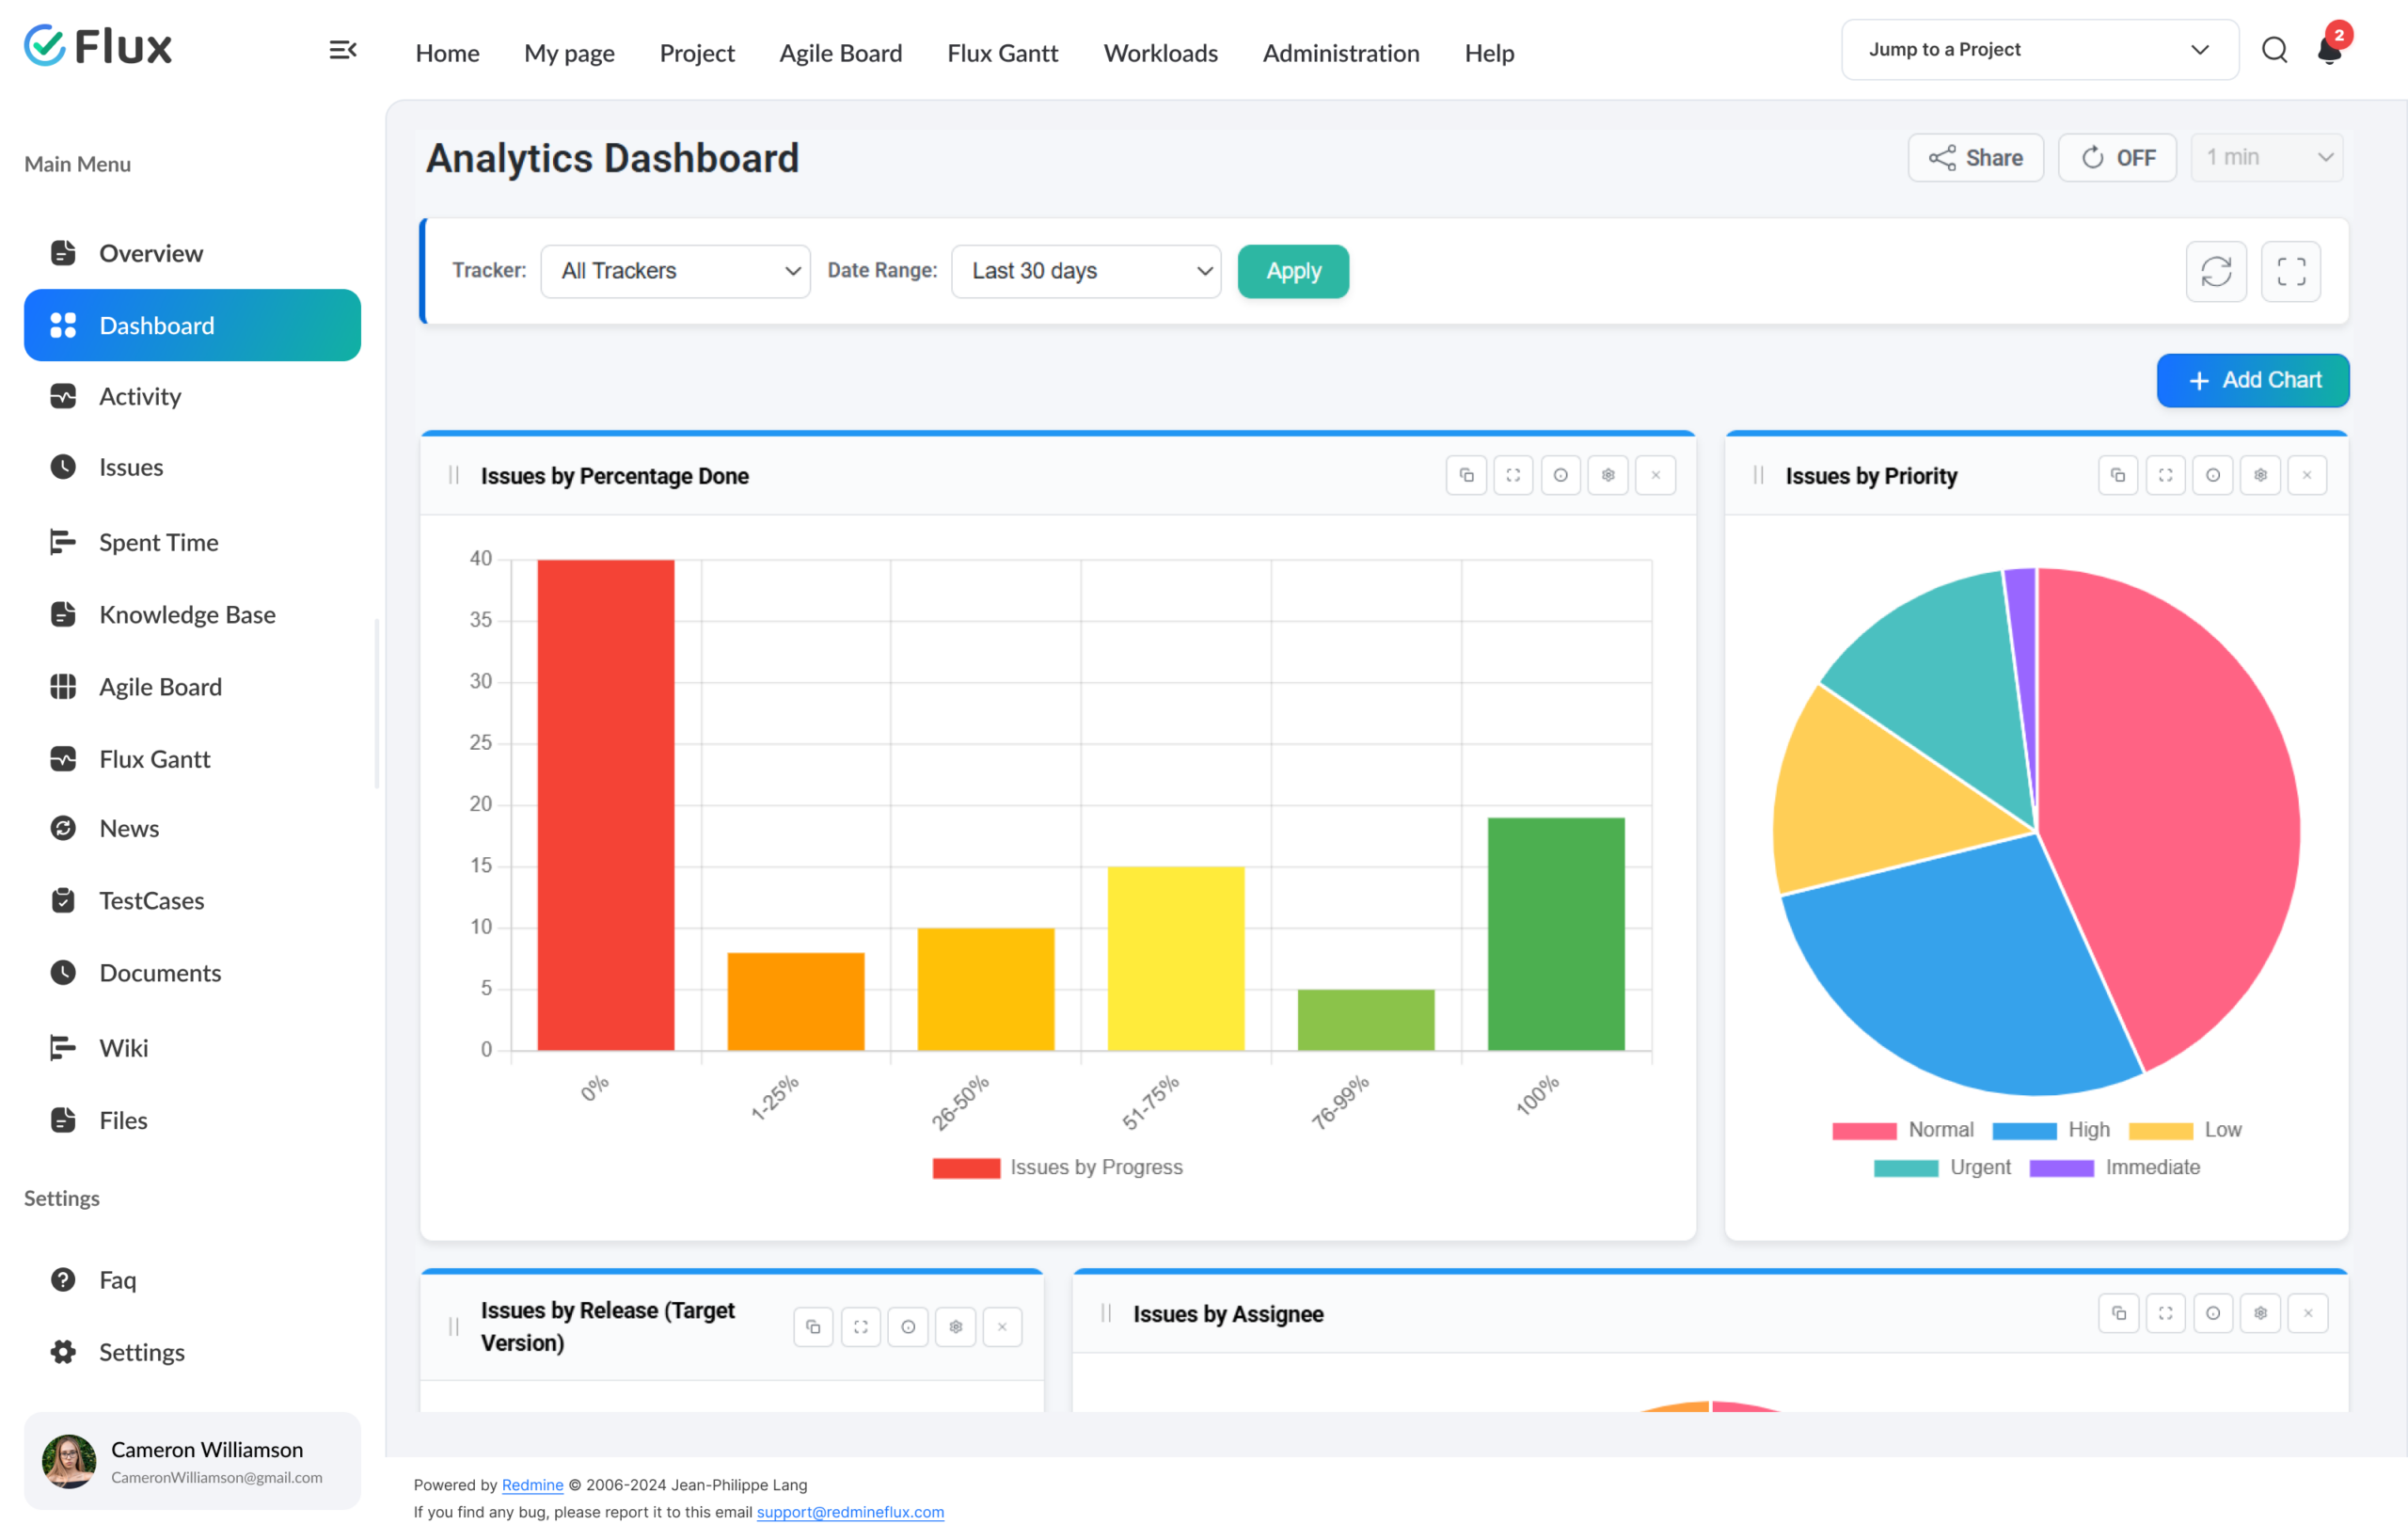
Redmineflux Custom Dashboard adds a fully customisable, real-time analytics dashboard to every Redmine project. Project managers, IT directors, and delivery heads configure charts from over 20 chart types — issue distribution, time tracking, user activity, project progress, saved queries — that pull live data from Redmine without building manual reports or exporting to a separate tool.
The report is the view.
Every widget reads directly from Redmine. Refresh the dashboard — or turn on auto-refresh — and status changes, new issues, and time entries are reflected without any preparation step. The dashboard is current every time anyone opens or refreshes it.
Every user with project access can open the Dashboard tab, arrange widgets by drag-and-drop, resize them, and save the layout. Drill down from any supported chart segment to see the exact issues behind it. Share the dashboard with anyone outside Redmine — generate a token-based public URL that opens in read-only mode, no account required. Manual status reporting stops being a job the team performs every week.
What your team gains
Specific shifts, not vague benefits.
Click any shift to see what changes in the product.
01
Project health visible without asking for an update.
Every dashboard widget pulls live Redmine data – no manual trigger, no export, no preparation. When a stakeholder opens the dashboard before a review meeting, the data is already current. Status meetings shift from gathering information to making decisions based on it.
02
Drill into any chart to see the issues behind it.
Click any bar, segment, or data point on a supported chart and an issue list panel opens showing the exact issues behind that number. The drill-down respects the active date range and chart filters — moving from summary to specifics takes one click, not a manual filter session.
03
Reporting overhead cut from every planning cycle.
Status preparation for weekly reviews, client updates, and leadership briefings is replaced by pointing people to a dashboard URL. The time previously spent building and distributing manual reports becomes time the team keeps for delivery work instead.
04
Share a live dashboard with people outside Redmine.
Generate a token-based public URL from the Share button. Anyone with the link sees the dashboard in read-only mode — no Redmine account, no login. The public view auto-refreshes, preserves per-chart custom dates, and hides all edit controls. Revoke access at any time by regenerating the token.
05
Stakeholder updates without granting Redmine access.
Set the dashboard to auto-refresh every 30 seconds, 1, 2, 5, or 10 minutes — both in the standard view and in the public read-only view shared via token. Open any dashboard or individual chart in full-screen mode for presentation or display-panel use without distraction from other UI elements.
06
One dashboard for the data leadership needs to see together.
Issue progress, time tracking, and project health all render from the same Redmine data foundation — no cross-system reconciliation, no manual imports. One dashboard, all the delivery data in a single view.
Core capabilities
The specifics, for people who want them.
Build dashboards from structured Redmine data views.
- Issue status charts: All Issues, Open Issues Only, or Closed Issues Only — over 20 chart types in total
- Time tracking summaries by user, activity, tracker, status, version, or role
- Project Progress Gauge showing overall project completion at a glance
- User activity and total-spent-hours views across the team
- Drill-down from any chart segment to the exact issues behind it
Configure every dashboard for the audience that will use it.
- Drag-and-drop widget layout for each intended audience
- Per-chart custom date ranges that override the global filter for that chart only
- Token-based public URL for read-only stakeholder access — no Redmine account required
- Widget-level filters by project, date range, and tracker
- No modification to Redmine’s underlying data model
Target any segment of your project data.
- Global filters: Tracker, Date Range, and Issue Status applied to all charts at once
- Per-chart filters: status, tracker, priority, assignee, version, activity, role, and user
- Saved issue query widgets from existing Redmine queries displayed as charts
- Saved time entry query widgets displayed alongside standard chart widgets
- Per-chart custom date range that overrides the global filter for that chart only
200+
teams trust Redmineflux worldwide
6 yrs
focused on Redmine, nothing else
5000+
plugin downloads powering real projects
We replaced our weekly status report with a live dashboard. Project health is now visible to everyone at any time – there is no preparation needed before a review meeting.
Deployment
Run it your way.
Managed Cloud
- Hosted by Redmineflux · included from Standard plan
- Daily backups · SLA-backed uptime
- No per-plugin licences – all-inclusive pricing
$2.99 / user / month
Get a Free demoSelf-hosted
- Drop-in install on your own Redmine
- One-time purchase · 1 year of support included
- Your infrastructure, your security perimeter
From $499 one-time
Buy plugin →Every plugin in Cloud also runs on self-hosted Redmine.
Role by role
What Custom Dashboard changes for each role.
Project ManagerDelivery tracking, issue visibility
Real-time delivery tracking and issue visibility without manual report preparation before every review cycle.
IT DirectorExecutive project health views
Executive-level project health views for the current project — current at any time, without requesting a status update.
CTOPortfolio visibility
Per-project analytics dashboard configured to surface delivery health and team performance — from a live Redmine data view that reflects the current state of each project.
Team LeadTeam performance, workload
Team-specific performance views and workload summaries configured for their project context — filtered by the trackers, date ranges, and assignees that matter to their team.
Pricing
Three ways to get Custom Dashboard.
Buy this plugin
Custom Dashboard – self-hosted
Support renewal after 1 year 30% of plugin price
One-time purchase · 1 year of support included · install on your Redmine in 15 minutes.
Buy Custom Dashboard →Save with a Bundle
Project Management Bundle
Includes Custom Dashboard + Gantt Chart + Agile Board + Timesheet + Knowledge Base + Issue Template + Notification.
See the Bundle →Or use Managed Cloud
Redmineflux Cloud
Included in Standard and Pro Cloud plans. Managed Redmine, no infrastructure work. Book a free demo →
See Cloud plans →See it with your project data
See your project data in one view.
Book a free demo and see Custom Dashboard live, or install the plugin on your existing Redmine and have real-time project health live in 15 minutes.
Frequently asked
Questions before you install.
The questions teams actually ask before adopting Custom Dashboard. If yours isn't here, check pricing or contact support.
Can I share the dashboard with people who don’t have a Redmine account?
Yes. Use the Share button on any dashboard to generate a token-based public URL. Anyone with the link opens the dashboard in read-only mode — no Redmine account, no login required. The public view auto-refreshes at your chosen interval and hides all edit controls. Regenerate the token at any time to revoke access.
Does the Dashboard Plugin pull data in real time?
Yes. All dashboard widgets read live data from your Redmine instance. Refresh manually with the Refresh button, or enable auto-refresh (30 seconds to 10 minutes) so charts stay current — no export and no manual report step.
Can dashboards be shared with external stakeholders?
Yes. Generate a token-based public URL from the Share button on any dashboard. Anyone with the link views the dashboard in read-only mode — no Redmine account required. The public view auto-refreshes at the same intervals as the live dashboard and preserves per-chart custom date filters. Revoke access instantly by regenerating the token from Share settings.
Which Redmine versions are supported?
The Redmineflux Dashboard Plugin supports all Redmine versions. Compatibility is verified with each plugin update.
How much does the Dashboard Plugin cost?
$499 one-time for self-hosted – 1 year of support included. Support renewal after 1 year 30% of plugin price. Bundle with the Project Management Bundle ($2,456 one-time) for Custom Dashboard + Gantt Chart + Agile Board + Timesheet + Knowledge Base + Issue Template + more. Or hosted at $2.99/user/month via Redmineflux Cloud Standard and above. See the pricing section above.
Is there a free demo available?
Yes – request a free demo and we’ll send a personalised demo link straight to your inbox. No credit card required, no commitment. Explore the real product at full capacity, at your own pace. Cloud starts at $1.99/user/month.